Annual Financial Report FY19
2020 Financial Report
REPORT
L.A. Controller Ron Galperin releases the Comprehensive Annual Financial Report (CAFR) each January to provide a complete picture of the City’s finances. On this page, you will find the Popular Annual Financial Report (PAFR), a summary of the CAFR that presents the information in a more accessible format, along with graphs and charts measuring how the City serves residents.
Each bar below contains a section of the report. Click on any to expand and read the full text of the section. Click again to collapse.
Fellow Angelenos:

As City Controller, I serve as chief auditor, accountant and watchdog over the City’s finances and operations. Each year, my office produces the Comprehensive Annual Financial Report (CAFR), which gives a complete financial picture of the City, including revenues, expenditures, assets and liabilities. The CAFR, along with the City’s Annual Budget and the City Administrative Officer’s financial status reports, is fundamental to understanding the City’s financial opportunities and challenges. On this page is the more accessible version of the report, the Popular Annual Financial Report (PAFR), which presents the data in an easier-to-read format so that everyone can understand the finances of the City.
Here’s a snapshot of the City’s finances for fiscal year 2019:
- $18.2 billion total City revenues, a 13.7 percent uptick over the year prior.
- $15.1 billion in expenses, a 7.5 increase over the year prior.
- $5.6 billion in General Fund revenues, a 7.4 percent increase over the year prior.
- $23.2 billion net position, a 15.6 percent increase over the year prior.
Our report also features charts with data that measures the performance of City departments. These help elucidate how well the City is using its finances to serve the public year over year. Here are some quick facts from the City Activities section below:
- 17,648 youth were placed in employment through HireLA, 850 more than the previous year.
- 25,368 fatal and injury traffic accidents occurred, while the number of traffic citations continued to fall to the lowest number since at least 2010.
- 35,543 animals were adopted from City shelters, while the number of animals euthanized declined to 6,427.
- 350,000 people attended library cultural programming, a decline of more than 5,000 from the year prior.
- 2.8 million people swam in City pools, an increase of 172,500 over the year before.
This information is just a taste of what you’ll find on this page. Our goals are to educate Angelenos on the finances of the City by being as transparent as possible and empower them to be better advocates for their communities. Please read through this report and let us know how we’re doing: controller.mejia@lacity.org or on Facebook or Twitter.
Sincerely,

Ron Galperin
City Controller
![]() The City and its surrounding metropolitan region have continued to experience growth in population and in economic diversity. Tourism and hospitality, professional and business services, direct international trade, entertainment including motion picture and television production, and wholesale trade and logistics all contribute significantly to local employment. Emerging industries are largely technology driven, and include biomedical, digital information technology, environmental technology and aerospace. More established components of the local industry include apparel, computer and electronic components, transportation equipment, fabricated metal and food processing.
The City and its surrounding metropolitan region have continued to experience growth in population and in economic diversity. Tourism and hospitality, professional and business services, direct international trade, entertainment including motion picture and television production, and wholesale trade and logistics all contribute significantly to local employment. Emerging industries are largely technology driven, and include biomedical, digital information technology, environmental technology and aerospace. More established components of the local industry include apparel, computer and electronic components, transportation equipment, fabricated metal and food processing.
Fueled by trade with Pacific Rim countries, the Port of Los Angeles handles the largest volume of containerized cargo of all U.S. ports and is ranked number one in container volume in U.S. waterborne foreign traffic. Los Angeles International Airport (LAX) is the fourth busiest airport in the world and second in the United States.
The seasonally adjusted unemployment rate in Los Angeles County was unchanged over the month at 4.4 percent in November 2019, down slightly from 4.6 percent in the prior year. Between October 2019 and November 2019, total non-farm employment in Los Angeles County increased by 38,500 to reach 4,656,900.
The City operates under a Mayor-Council form of government. The Mayor supervises the administrative processes of the City and works with the City Council in matters relating to legislation, budget and finance. The 15-member City Council enacts ordinances, levies taxes, authorizes contracts and public improvements, adopts zoning and other land use contracts, and provides necessary resources for the budgetary departments and offices of the City. The City Controller and City Attorney are independently elected citywide.
The City has 45 departments, bureaus, commissions and offices, 38 of which have their operating funds annually budgeted by the City Council. The Department of Water and Power (DWP), Harbor Department, and the Department of Airports are publicly-owned entities under the control of boards appointed by the Mayor and confirmed by the City Council. Several other departments are fiscally independent or under the control of independent boards.
Public services provided by the City include police, fire and paramedics, residential refuse collection and disposal, wastewater collection and treatment, street maintenance and traffic management, enforcement of building safety laws, libraries, recreation and parks, community development, housing and services for seniors, planning; two airports, harbor, power and water services, and the convention center. Performance data on some of these services is collected below in the “City Activities” section of this page.
For the fiscal year that ended on June 30, 2019, total City revenues were $18.2 billion, an increase of 13.7% over the prior year.
Expenses were $15.1 billion, 7.5% more than the prior year.
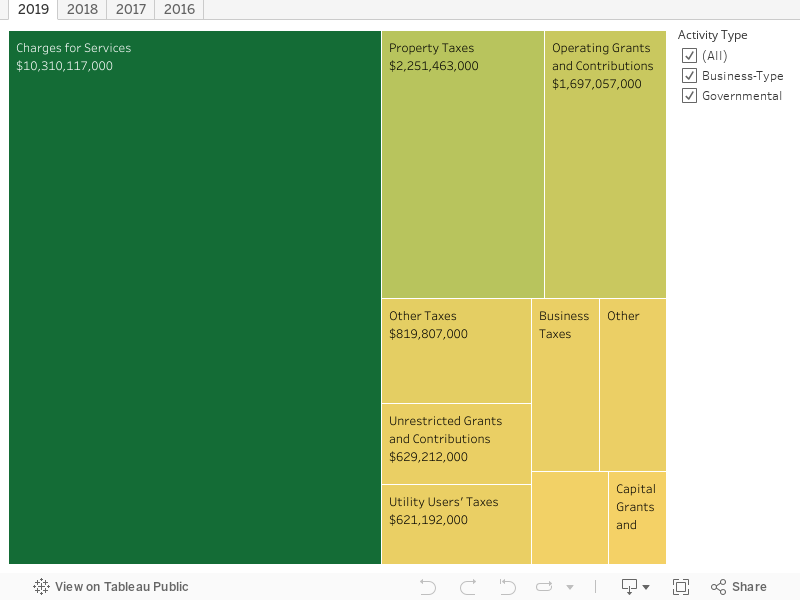
Fiscal Year 2019 Total City Revenues: $18.2 billion
Click to toggle between years.
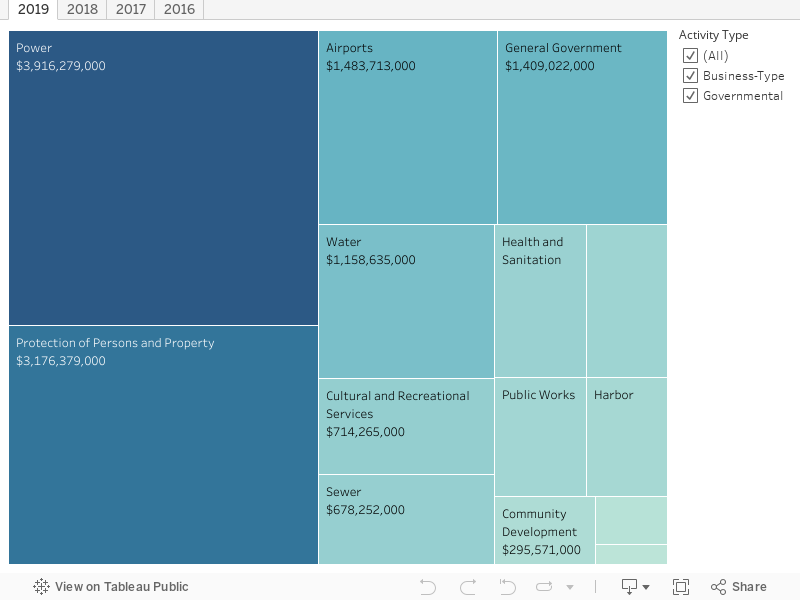
Fiscal Year 2019 Total City Expenditures: $15.1 billion
Click to toggle between years.
Governmental Activities
Total revenues of governmental activities were $9.2 billion, while total expenses were $7.3 billion. Of the $7.3 billion total expenses, 69.8% was funded by taxes and other general revenues, and the remaining 30.2% was funded by program revenues and available net position. Program revenues are resources obtained from parties outside of the City and charges for services between the governmental and business-type activities.
Total expenses increased by $246.8 million or 3.5% above fiscal year 2018. Increased expenses were due primarily to increases in health and sanitation of $108.9 million, community development of $79.3 million, and cultural and recreational services of $32.2 million, offset by a combined decrease of $49.3 million in public works and protection of persons and property. Interest on long-term debt posted an increase of $18.5 million.
Business-Type Activities
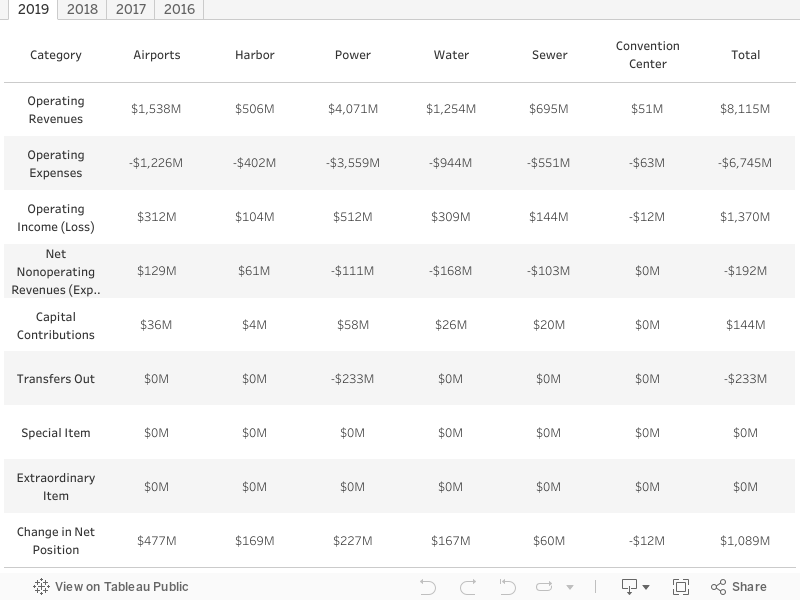
The $9.0 billion combined operating revenues of the City’s six business-type activities were $1.3 billion more than the $7.7 billion combined operating costs.
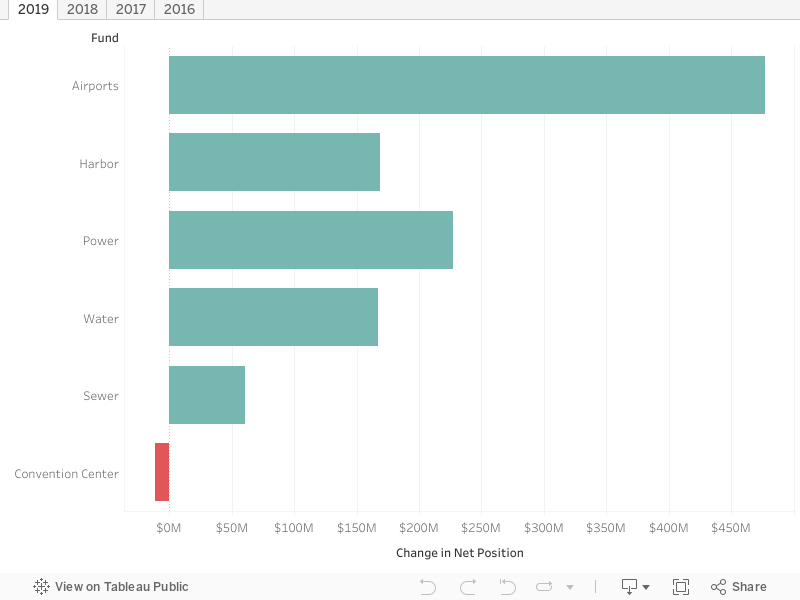
Business-Type Activities: Change in Net Position
Enterprise funds are used to report the functions presented as business-type activities in the government-wide financial statements, they are generally used to account for services for which the City charges customers – either outside customers or other departments/funds of the City. All of the City’s enterprise funds, except the convention center, are considered major funds. The operating results of the City’s six enterprise funds are reflected in the change in net position statement below.
Click to toggle between years.
Click to toggle between years.
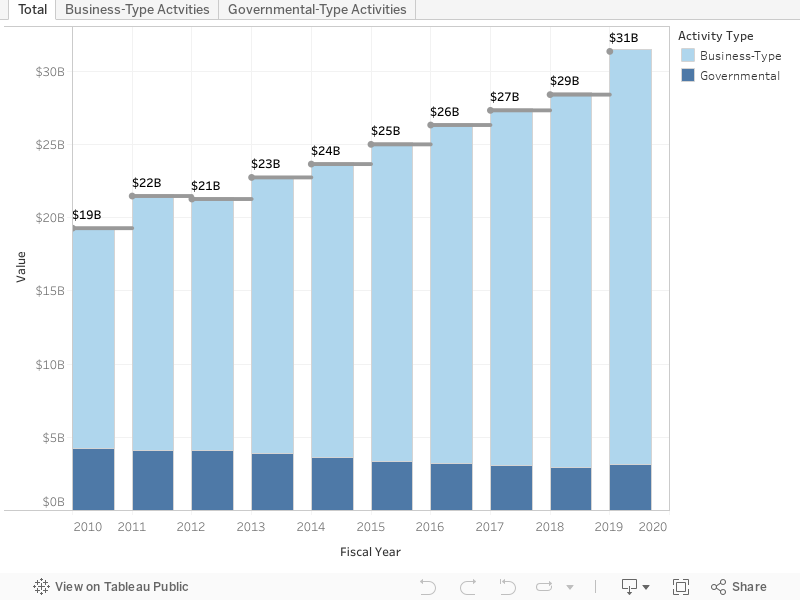
Bonded Debt and Long-Term Notes Payable: $31.5 billion, 10.4% increase from Fiscal Year 2018
Click to toggle between activity types.
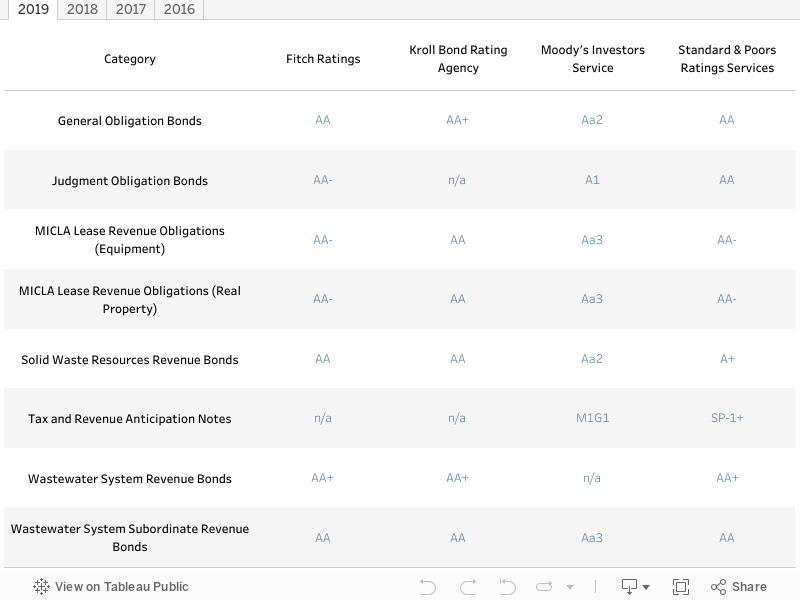
Ratings of the City’s Debts by Rating Agencies
Click to toggle between years.
The City has established guidelines for the structure and management of the City’s debt, which include target and ceiling levels for certain debt ratios to be used for financial planning purposes and restrictions on the types of items that can be financed, limiting financing only to those items with a useful life of six years or more. In accordance with this policy, the ratio of annual debt payments cannot exceed 15% of General Fund revenues for voter-approved and non-voter approved debt overall, and cannot exceed 6% of General Fund revenues for non-voter approved debt alone. The 6% ceiling for non-voter approved debt may be exceeded only if there is a guaranteed new revenue stream for the debt payments and the additional debt will not cause the ratio to exceed 7.5%, or there is no guaranteed revenue stream but the 6% ceiling shall not be exceeded for more than one year.
Of the $31.5 billion long-term bonds and notes payable, $865.5 million were General Obligation bonds.
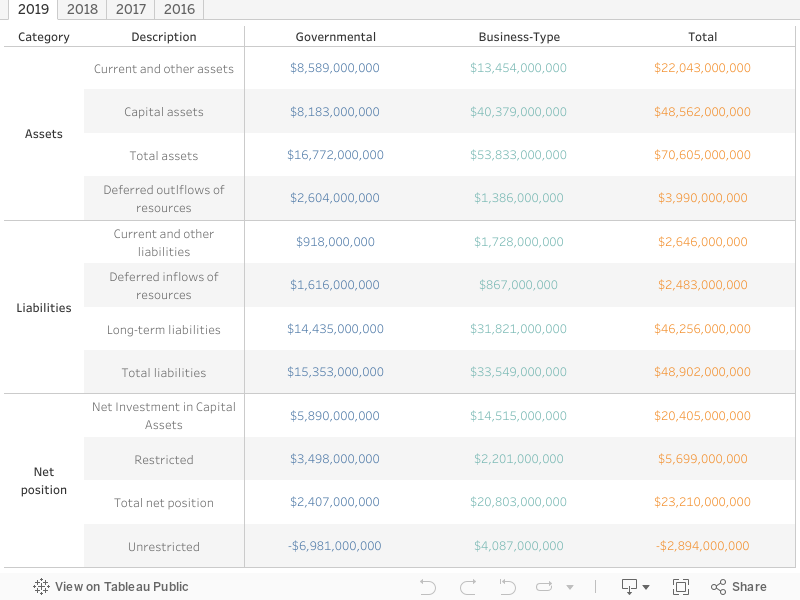
The net position is the financial position of the City – assets and deferred outflows of resources minus liabilities and deferred inflows of resources.
Total City Assets: $70.6 billion. Deferred Outflows of Resources: $4.0 billion. Total: $74.6 billion.
![]()
Assets represent what the City owns:
• Cash and pooled investments
• Receivables
• Capital assets (land, buildings and infrastructure)
Total City Liabilities: $48.9 billion. Deferred Inflows of Resources: $2.5 billion. Total: $51.4 billion.
![]()
Liabilities represent what the City owes:
• Bonds and notes
• Claims and judgments
• Unearned revenue
• Accounts payable and accrued expenses
Net Position: $23.2 billion, $3.1 billion (15.6%) increase from FY18
The net position of $23.2 billion consisted of:
- Net investment in capital assets: $20.4 billion, including land, building, infrastructure and equipment, less accumulated depreciation and outstanding debt related to acquisition, construction or improvements ($5.9 billion in governmental activities and $14.5 billion in business-type activities). This is an increase of $673 million from fiscal year 2018.
- Restricted net position: $5.7 billion, which represents external restrictions imposed by creditors, grantors, contributors, laws of other governments, constitutional provisions or enabling legislation ($3.5 billion in governmental activities and $2.2 billion in business-type activities). This is an increase of $1.0 billion from fiscal year 2018.
- Unrestricted Net position: $2.9 billion deficit due to the City’s pensions and other long-term obligations (-$7.0 billion in governmental activities and +$4.1 billion in business-type activities). The deficit decreased by $1.4 billion from fiscal year 2018.
The City’s net position is illustrated in the table below. Click to toggle between years.
The General Fund is the general operating fund of the City and includes transactions of the Reserve Fund and other accounts that have General Fund type activity for generally accepted accounting principles reporting purposes. On June 30, 2019, the General Fund reported a total fund balance of $1.1 billion, composed of $55.3 million nonspendable; $33.1 million committed; $334.2 million assigned for general government purposes; and $683.4 million unassigned. View the Management’s Discussion and Analysis section for more information about Governmental and Business-Type Activities.
In fiscal year 2019, General Fund revenues exceeded expenditures by $543.1 million.
Revenues
 FY19 Total General Fund Revenues: $5.6 billion, 7.4% increase from FY18
Click to toggle between years.
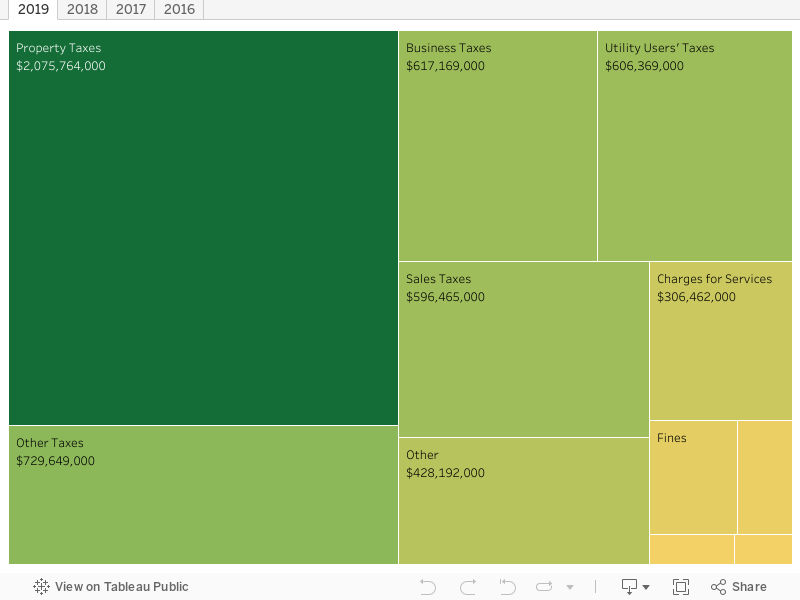
Tax revenues increased by $268.6 million or 6.2% from fiscal year 2018 as a result of the sustained growth in the economy. Taxes accounted for $4.6 billion (82.1%) of General Fund revenue.
Property taxes, which represent 36.8% of General Fund revenue, increased by $117.7 million (6.0%), primarily due to higher current secured property tax receipts of $113.5 million.
Economy-sensitive revenues reflect the steady improvement in the economy. Sales and business tax revenues increased by $62.2 million (11.6%) and $82.2 million (15.4%) respectively, due to growth in the local economy and new recreational cannabis retail activity.
Utility users’ tax revenues posted a net decrease of $34.3 million (5.4%), primarily due to the continued decline of Telephone Users’ Tax receipts of $36.5 million.
Other tax revenues increased by $40.8 million or 5.9%, primarily due to increases in Transient Occupancy Tax receipts from short-term rentals and Franchise Income receipts from solid waste collection franchise fees.
Licenses and permits revenues decreased by $4.6 million (11.9%), primarily due to the transfer of cannabis licenses fees to a special revenue fund.
Charges for services decreased by $9.4 million (3.0%), primarily due to lower charges for Fire Department emergency services and election reimbursements.
Net investment earnings increased by $78.0 million, due to higher account balances and increases in the fair market value of investments.
Expenditures
 FY19 General Fund Expenditures: $5.1 billion, 5.2% increase from FY18
Click to toggle between years.
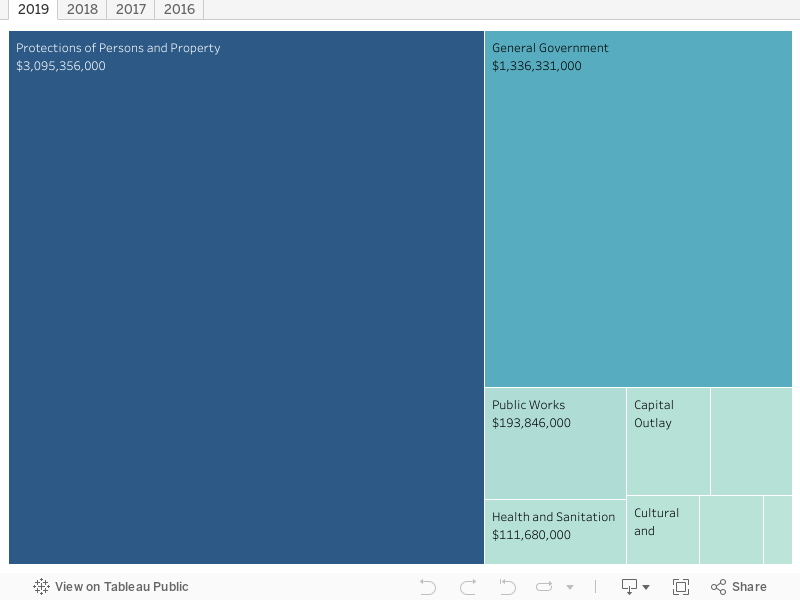
General government expenditures increased by $3.7 million (0.3%), due to higher salaries, benefits and health insurance subsidies offset by lower liability claims payouts, equipment acquisition, and contractual services.
Protection of persons and property expenditures increased by $131.5 million or 4.4% primarily due to increased salaries, benefits and pension contributions.
Public works expenditures increased by $7.5 million due primarily to increased pension contributions.
Health and Sanitation increased by $16.0 million or 16.7% primarily due to $11.7 million in increased liability claims payouts.
Transportation expenses decreased by $11.7 million or 9.8% due to decreased liability claims payouts offset by increases in pension contributions and contractual services.
Community development expenses increased by $14.9 million or 38.2%, primarily due to an increase in outlays of grant subsidies to outside organizations for community projects.
CITY ACTIVITIES
Each bar below represents a core City function and contains performance data about specific activities that impact residents within the scope of that function. Click on any to expand and read the full text of the section. Click again to collapse.