Annual Financial Report FY18
2019 Financial Report
Annual Financial Report
The City of Los Angeles is the second largest city in America with a population of approximately 4 million, an operating budget of more than $9 billion and more than 47,000 employees throughout dozens of departments, bureaus and offices.
Every year, the Controller publishes the Comprehensive Annual Financial Report (CAFR), which details the City’s operations and financial health over the past fiscal year. The CAFR includes financial information on the City’s revenues and expenditures, assets and liabilities, operational expenses, statistics on the performance of the City’s departments, and many other details on the City’s finances. For the City’s complete and detailed official financial statements, view the full CAFR ▸
The Popular Annual Financial Report summarizes the findings of the CAFR and presents the data in an easy-to-read format so that everyone can understand the finances of the City. It is an interactive collection of charts and graphs, detailing every function and service the City provides. Our goal is to educate and empower Angelenos about the City’s finances to offer the highest levels of transparency and trust to transform your understanding of Los Angeles.
Controller’s Message
Fellow Angelenos:

As City Controller, I serve as chief auditor, accountant and watchdog over the City’s finances and operations. Each year, my office produces a Comprehensive Annual Financial Report (CAFR), which details the City’s revenues, expenditures, assets and liabilities. Enclosed you will find the fifth Popular Annual Financial Report, which summarizes the CAFR and presents the data in an easy-to-read format so that everyone can understand the finances of the City.
I am pleased to report that the Government Finance Officers Association of the United States and Canada (GFOA) awarded the City its fourth Outstanding Achievement in Popular Annual Finance Reporting award for its Community Financial Report for the Fiscal Year ended June 30, 2018.
We’re continuing to make financial data more interactive by posting it on our open data site, ControlPanel LA.
The PAFR is a financial reporting project for our office. Our goals are to educate and empower Angelenos on the finances of the City. We want to hear from you-tweet @LAController or email controller.mejia@lacity.org with your feedback.
Sincerely,

Ron Galperin
City Controller
Introduction
![]()
Local Economy
The City and its surrounding metropolitan region have continued to experience growth in population and in economic diversity. Tourism and hospitality, professional and business services, direct international trade, entertainment including motion picture and television production, and wholesale trade and logistics all contribute significantly to local employment. Emerging industries are largely technology driven, and include biomedical, digital information technology, environmental technology, and aerospace. More established components of the local industry include apparel, computer and electronic components, transportation equipment, fabricated metal and food processing.
City Organization
The City operates under a Mayor-Council form of government. The Mayor supervises the administrative processes of the City and works with Council in matters relating to legislation, budget, and finance. The 15-member Council enacts ordinances, levies taxes, authorizes contracts and public improvements, adopts zoning and other land use contracts, and provides necessary resources for the budgetary departments and offices of the City. The City Attorney and City Controller are independently elected.
The City has 38 departments, bureaus, commissions, and offices for which operating funds are annually budgeted by the Council. The Department of Water and Power (DWP), Harbor Department, and the Department of Airports are under the control of boards appointed by the Mayor and confirmed by the Council.
General Fund

The General Fund is the general operating fund of the City and includes transactions of the Reserve Fund and other accounts that have General Fund type activity for generally accepted accounting principles (GAAP) reporting purposes. At June 30, 2018, the General Fund reported a total fund balance of $929.2 million, composed of $41.8 million nonspendable; $25.2 million committed; $289.1 million assigned for general government purposes; and $573.2 million unassigned. View the Management’s Discussion and Analysis for more information about Governmental and Business-Type Activities.
In the 2018 fiscal year, General Fund revenues exceeded expenditures by $408.9 million.
Revenues and Expenditures
![]()
FY 2018 Total Revenues: $5.2 billion
⬆ 4.8% from FY 2017
Chart values in thousands of dollars. Click to toggle between years. View Data ▸
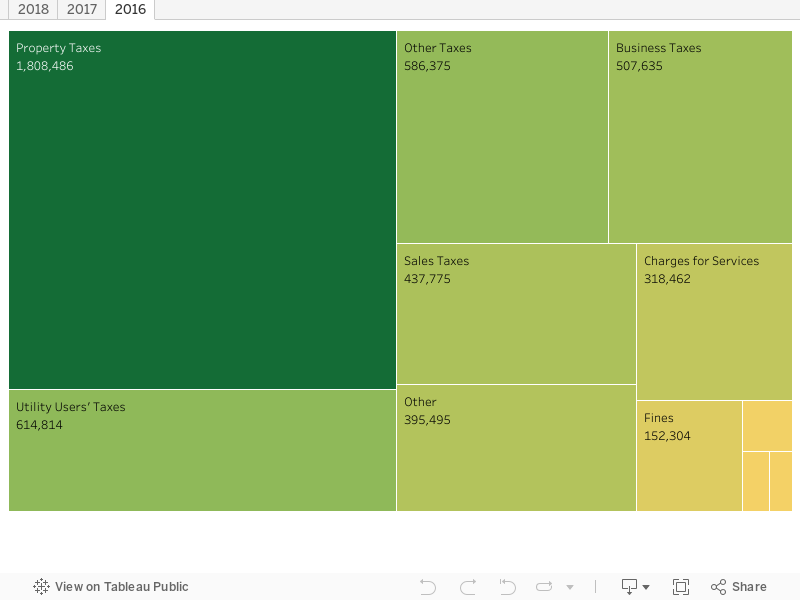
Revenues in Fiscal Year 2018
Overall tax revenues grew $177.8 million or 4.3% from fiscal year 2017 as a result of the sustained modest growth in the economy.
Total taxes accounted for nearly $4.4 billion (83.0%) of General Fund revenue.
Total property taxes, which represent 37.3% of General Fund revenue, increased by $100.4 million (5.4%).
Mainly due to higher current secured property tax receipts of $88.3 million.
Economy-sensitive revenues reflect the steady improvement in the economy, but signs of weakening are present.
Sales tax revenues grew $12.3 million or 2.4% due to low to modest growth in the local economy. Business tax revenues declined $11.5 million or 2.1% primarily due to lower cannabis business taxes.
Utility users’ tax revenues posted a net increase of $29.5 million (4.8%).
Primarily due to electricity users’ tax growth from rate adjustments and increased power usage offset by lower telephone users’ tax receipts.
Other tax revenues were up $47.0 million or 7.3%
Mainly due to the $33.4 million increase in transient occupancy tax receipts from short-term rentals, $15.0 million higher franchise income from the first year of solid waste collection franchises for multi-family residences and commercial properties.
Licenses and permits revenues slightly went up by $1.6 million (4.4%).
Mainly due to new revenue from the first year of cannabis license fee of $4.0 million offset by declines in other receipts
Charges for services increased by $72.5 million (29.8%).
Mainly due to the $53.4 million increase in receipts for services provided by Police Department to LAMTA and an increase of $17.5 million in reimbursement of General Fund costs from Sewer.
Net investment earnings were up by $4.7 million
Due to the higher rate of return in cash management
Revenues in Fiscal Year 2017
Overall tax revenues grew $223.9 million or 5.7% from fiscal year 2016 as a result of the sustained modest growth in the economy.
Total taxes accounted for nearly $4.2 billion (83.5%) of General Fund revenue.
Total property taxes, which represent 37.1% of General Fund revenue, increased by $149.5 million (8.8%).
Mainly due to higher current secured property tax receipts of $59.9 million, increase in Community Redevelopment Agency (CRA) property tax increment of $47.6 million from the sale of former CRA properties, and higher vehicle license fee replacement receipts of $25.2 million.
Economy-sensitive revenues reflect the steady improvement in the economy.
Sales tax revenues grew $84.1 million or 19.2% due to the restoration of the 1% local tax rate resulting from the unwinding of the State’s triple flip. The increase in business tax revenues of $38.9 million or 7.7% is reflective of the steady growth in business activities despite the net effect of the City’s phased-in tax reduction to the top business tax rate.
Utility users’ tax revenues posted a net decrease of $3.7 million (0.6%).
Primarily due to lower accruals of telephone users’ tax revenue from the continued decline in landline usage as consumers opted for less costly voice and texting plans.
Other tax revenues were up $55.4 million or 9.4%
Mainly due to $39.4 million increase in transient occupancy tax driven by increased lodging and occupancy demand, $15.0 million higher documentary transfer tax attributed to home price appreciation from limited housing inventory, and $1.0 million increase in parking occupancy tax.
Licenses and permits slightly went up by $4.4 million (13.5%).
Mainly due to sustained growth in construction activities during the fiscal year that resulted in higher revenues earned from building material permit fees of $1.1 million, $1.8 million increase in lateral shoring support shoring fees and an increase of $1.5 million in miscellaneous permits and fees.
Charges for services decreased by $75.1 million (23.6%).
This was due to the reclassification of revenues resulting from interdepartmental charges as credits to the appropriate expense accounts instead of revenues. Intergovernmental revenues decreased by $5.4 million or 25.9% due mainly to lower receipts from state-mandated program grants.
Net investment earnings were down by $37.3 million
Caused by the decline in fair value of investments in fiscal year 2017 offset by earnings from higher available cash balance.
Licenses and permits revenues slightly went up by $1.6 million (4.4%).
Mainly due to new revenue from the first year of cannabis license fee of $4.0 million offset by declines in other receipts
Charges for services increased by $72.5 million (29.8%).
Mainly due to the $53.4 million increase in receipts for services provided by Police Department to LAMTA and an increase of $17.5 million in reimbursement of General Fund costs from Sewer.
Net investment earnings were up by $4.7 million
Due to the higher rate of return in cash management
 FY 2018 Total Expenditures: $4.8 billion
⬆ 0.0% from FY 2017
Chart values in thousands of dollars. Click to toggle between years. View Data ▸
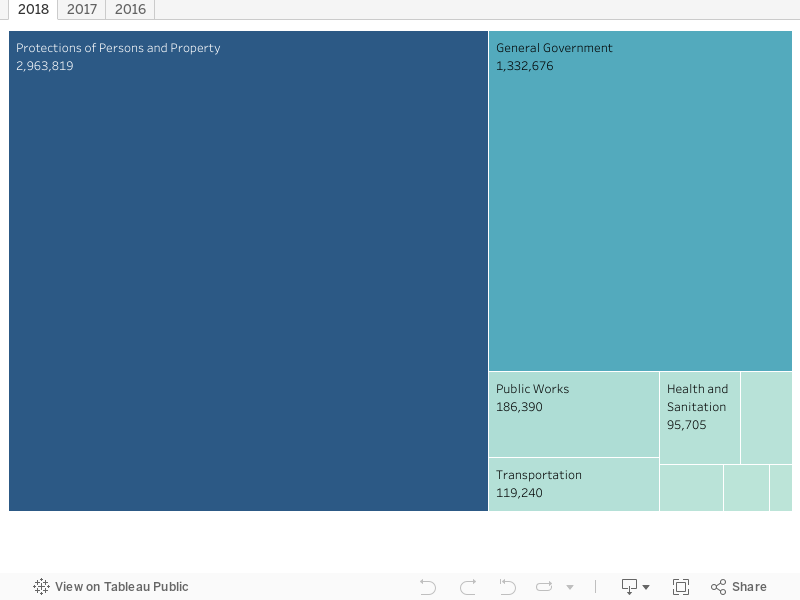
Expenditures in the Fiscal Year 2018
General Fund expenditures were $4.8 billion
General government expenditures posted a $24.2 million decrease or 1.8 %
Due to $17.3 million lower Los Angeles City Employees’ Retirement System (LACERS) pension cost, $10.5 million interfund payments and $46.0 million liability claims payouts. These decreases were offset by $49.2 million higher salaries, benefits and health insurance subsidies.
Protection of persons and property expenditures grew by $89.7 million or 3.1%
Due to $78.4 million higher salaries, benefits and pension cost, $17.2 million and $14.2 million higher police and fire contractual services, respectively, and $3.3 million acquisition of fire and police operating equipment and supplies. These increases were offset by $18.0 million lower liability claims and $5.1 million from interfund payments.
Public works expenditures decreased by $81.2 million or 30.5%
Due to decrease of $55.6 million in salaries, benefits, health insurance subsidies and contractual services, $11.0 million liability claims payouts, $2.5 million lower utility expenses, and $8.8 million LACERS pension costs.
Health and Sanitation increased by $7.9 million or 9.1%
Due to an increase of $22.0 million in salaries, benefits, contractual services, and liability claims. These increases were offset by $8.0 million lower LACERS pension cost and $7.4 million interfund payments.
Cultural and Recreational Services increased by $49.8 million or 407%
Due to an increase of $43.0 million LACERS pension cost and $8.0 million in liability claims payout.
Transportation expenses decreased by $10.7 million or 8.2%
Due to lower $11.4 million LACERS pension cost and liability claims and $2.7 million interfund payments. These were offset by an increase of $3.4 million in salaries, benefits, and contractual services.
Community development expenses reduced by $39.9 million or 50.5%
Due to a decline in outlays of grant subsidies to outside organizations for community projects of $27.4 million, $24.9 million in liability claims and pension cost. These were offset by $10.2 million higher salaries and contractual services.
Expenditures in the Fiscal Year 2017
General Fund expenditures were $4.8 billion, an increase $266.4
million (5.8%) from fiscal year 2016.
As in the previous fiscal year, interfund reimbursements of $426.7 million (pertaining to repayments mainly from special funds to the General Fund for particular expenditures that it initially paid for them) were treated as reductions from expenditures of the General Fund instead of being credited as revenues. These accounted for decreases in expenditures as discussed below.
General government expenditures posted a $40.7 million increase (3.1%).
Due to $31.6 million higher salaries, benefits, health insurance and workers compensation costs. Allocated share of the general government in liability claims and LACERS pension cost of $18.9 million and $16.6 million respectively also accounted for the increase. These increases were offset by a reduction of $29.5 million interfund payments.
Protection of persons and property expenditures grew by $76.4 million or 2.7%
Due to $63.3 higher salaries and benefits, $14.9 million and $11.9 million higher police and fire contractual services respectively, and $2.7 million acquisition of fire and police operating equipment and supplies. These increases were offset by a lower share in allocated liability claims of $15.7 million.
Increases of $105.4 million in salaries, benefits,health insurance subsidies, COLA adjustments mainly accounted for the $155.7 million higher public works expenditures.
Additional increases were $33.1 million in liability claims payout, $6.9 million higher utility expenses, $2.5 million acquisition of construction equipment and supplies, and $12.4 million allocated share in pension costs. These increases were offset by $4.6 million reduction from interfund payments.
Health and Sanitation declined by $43.7 million and Cultural and Recreational Services by $45.6 million.
Reductions of expenses were related to interfund reimbursements.
Transportation expenses were $24.5 million higher.
Mainly due to increases of $8.3 million in salaries, benefits, and contractual services, $17.7 million in liability claims and $5.3 million allocated share in pension costs. These were offset by a reduction of interfund reimbursements of $6.9 million.
Community development expenses were $76.6 million higher.
Due to outlays incurred in granting subsidies to outside organizations for community projects of $43.8 million, $22.3 million increase in liability claims and $9.8 million higher salaries and contractual services.
Net Position
Balancing the City’s Assets and Liabilities
The Net Position is the financial position of the City – assets and deferred outflows of resources less liabilities and deferred inflows of resources.
![]()
Assets represent what the City owns
• Cash and pooled investments
• Receivables
• Capital assets (land, buildings and infrastructure)
![]()
Liabilities represent what the City owes
• Bonds and notes
• Claims and judgments
• Unearned revenue
• Accounts payable and accrued expenses
Condensed Statement of Net Position
Table values in billions of dollars
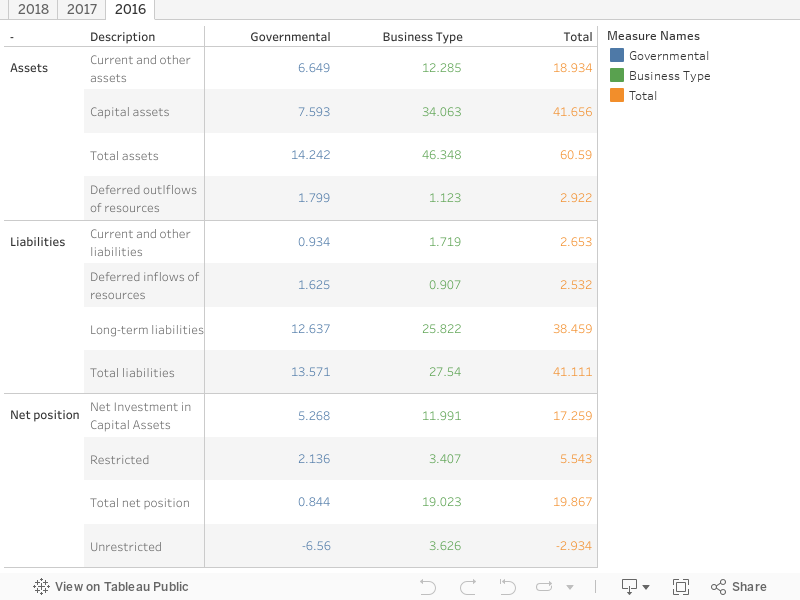
Fiscal Year 2018
Total City Assets: $64.8 billion
Deferred Outflows of Resources: $3.9 billion
Total City Liabilities: $46.2 billion
Deferred Inflows of Resources: $2.5 billion
Net Position: $20.1 billion ⬆ $0.9 billion (4.3%) from Fiscal Year 2017
The net position of $20.1 billion consisted of:
- Net investment in capital assets: $19.7 billion, e.g. land, building, infrastructure and equipment less accumulated depreciation and outstanding debt related to acquisition, construction, or improvements ($5.7 billion in governmental activities, $14.0 billion in business-type activities).
- Restricted net position: $4.7 billion, which represents external restrictions imposed by creditors, grantors, contributors, laws of other governments, constitutional provisions or enabling legislation ($2.7 billion in governmental activities, $2.0 billion in business-type activities).
- Unrestricted Net position: $4.3 billion deficit due to the City’s pensions and other long-term obligations ($8.0 billion deficit in governmental activities, $3.7 billion in business-type activities).
Fiscal Year 2017
Total City Assets: $63.0 billion
Deferred Outflows of Resources: $4.5 billion
Total City Liabilities: $44.7 billion
Deferred Inflows of Resources: $1.8 billion
Net Position: $21.0 billion ⬆ $1.1 billion (5.6%) from Fiscal Year 2016
The net position of $21.0 billion consisted of:
- Net investment in capital assets: $18.2 billion, e.g. land, building, infrastructure and equipment less accumulated depreciation and outstanding debt related to acquisition, construction, or improvements ($5.4 billion in governmental activities, $12.9 billion in business-type activities).
- Restricted net position: $5.9 billion, which represents external restrictions imposed by creditors, grantors, contributors, laws of other governments, constitutional provisions or enabling legislation ($2.5 billion in governmental activities, $3.4 billion in business-type activities).
- Unrestricted Net position: $3.1 billion deficit due to the City’s pensions and other long-term obligations ($6.6 billion deficit in governmental activities, $3.5 billion in business-type activities).
City Activities
Breakdown of city activities by function
Select an activity below to learn more.

Airports
Los Angeles World Airports (LAWA)

Community Development
Aging – Planning – Disability – Housing & Community Investment – Economic & Workforce Development

Cultural and Recreational Services
Cultural Affairs – El Pueblo – Library – Recreation & Parks – Zoo

Harbor
Port of Los Angeles (POLA)

Health Sanitation and Sewer
Bureau of Sanitation

Protection of People and Property
Police – Fire – Animal Services – Building & Safety – Emergency Management

Public Works
Contract Administration – Engineering – Street Lighting – Street Services – Board of Public Works
Transportation
Department of Transportation

Water and Power
Department of Water and Power (DWP)
Management’s Discussion and Analysis
Revenues and Expenses
Governmental Activities
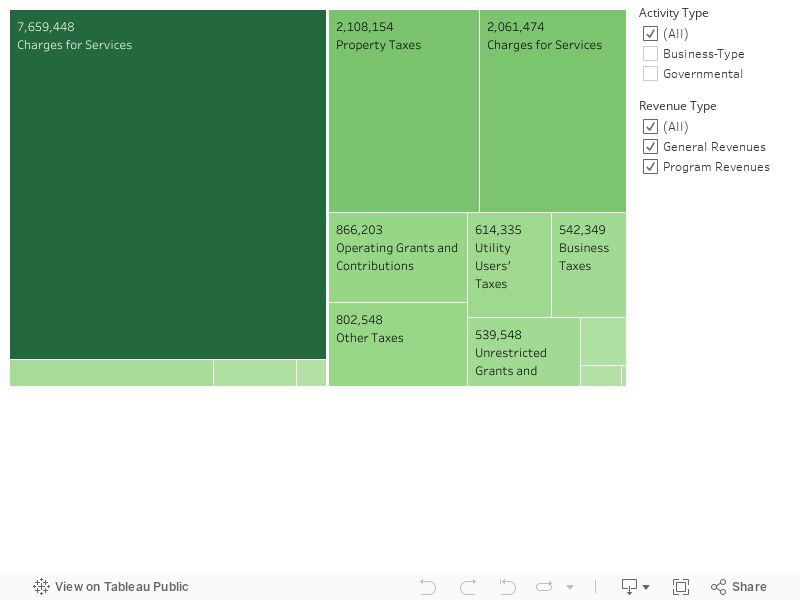
For the fiscal year ended June 30, 2018, total revenues of governmental activities were $7.8 billion while total expenses were$7.1 billion. Of the $7.1 billion total expenses, 65.6% was funded by taxes and other general revenues, and the remaining 34.4% was funded by program revenues, transfers from business-type funds and available net position. Program revenues are resources obtained from parties outside of the City, and charges for services between the governmental and business-type activities.
Total expenses decreased by $47.3 million or 0.7% below fiscal year 2017. Decreases in expenses were attributed to decreases in the general government of $100.6 million, protection of persons and property of $136.5 million, transportation of $2.6million and community development of $29.1 million offset by an increase of $217.9 million in public works, health and sanitation, and cultural and recreational services. Interest on long-term debt posted an increase of $3.6 million.
Business-type Activities
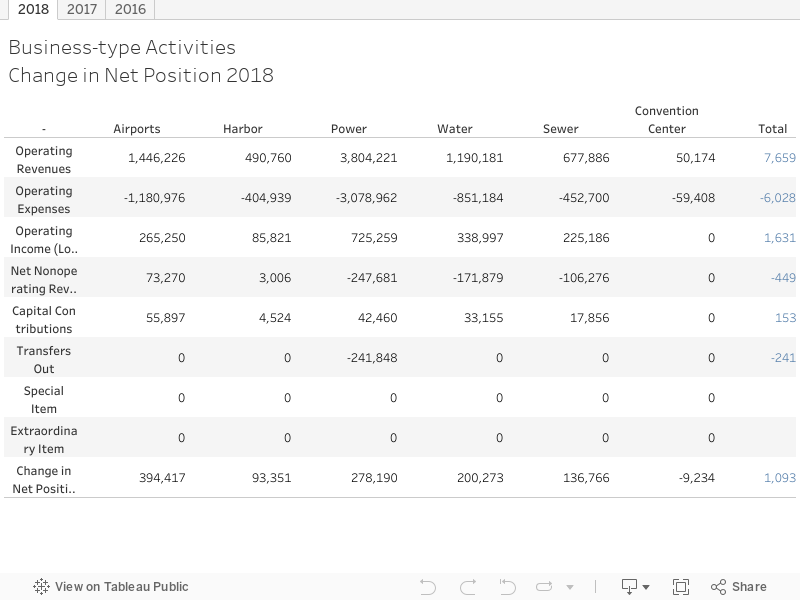
The $7.6 billion combined operating revenues of the City’s six business-type activities were $1.6 billion more than the $6.0billion combined operating costs.
Fiscal Year 2018 Revenues: $16.0 billion
Chart values in thousands of dollars. Click to toggle between years.
Fiscal Year 2018 Expenses: $14.0 billion
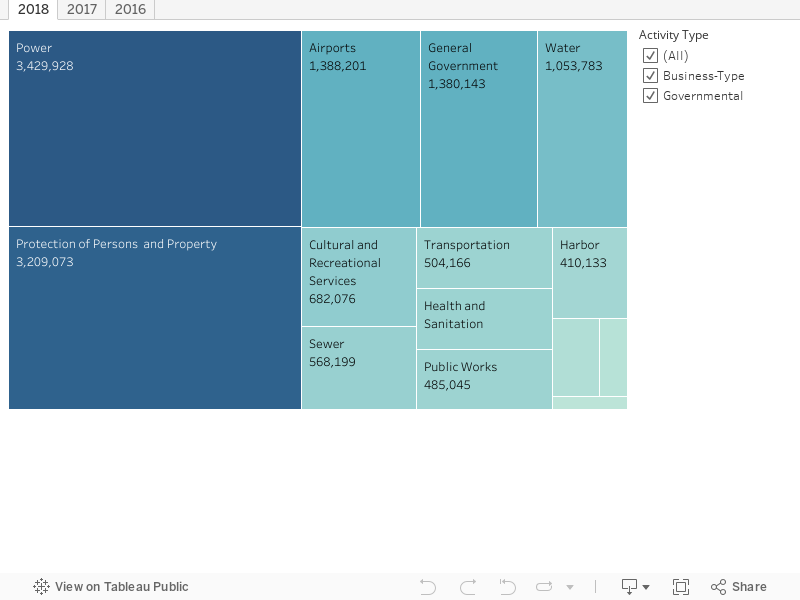
Business-type Activities
Enterprise funds are used to report the functions presented as business-type activities in the government-wide financial statements, they are generally used to account for services for which the City charges customers – either outside customers, or other departments/funds of the City. All of the City’s enterprise funds, except the convention center, are considered major funds.
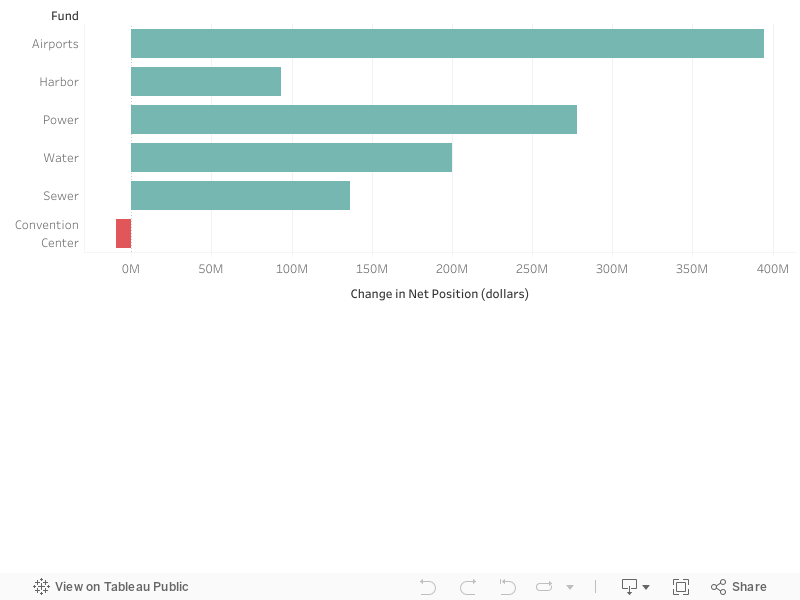
The operating results of the City’s six enterprise funds are reflected in the change in net position statement below.
Business-Type Activities: Change in Net Position
Bonded Debt and Long-Term Notes Payable: $28.5 billion ⬆ 3.9% from Fiscal Year 2017
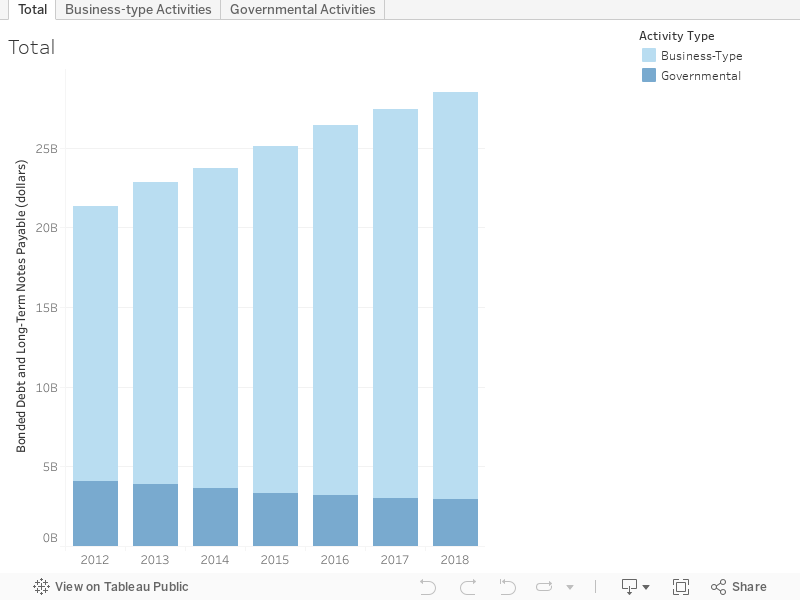
Ratings of the City’s debts by rating agencies, as of June 30th:
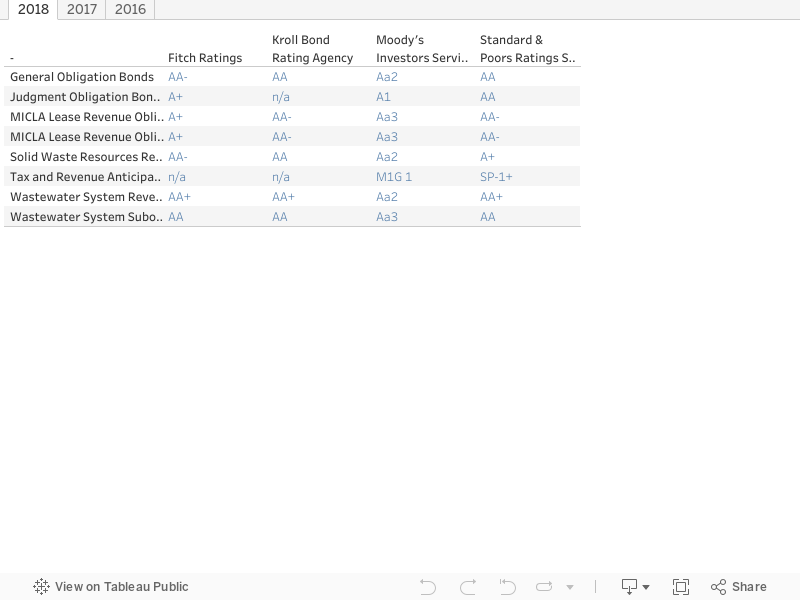
The City has established guidelines for the structure and management of the City’s debt, which include target and ceiling levels for certain debt ratios to be used for financial planning purposes and restrictions on the types of items that can be financed, limiting financing only to those items with a useful life of six years or more.
In accordance with this policy, the ratio of annual debt payments cannot exceed 15% of General Fund revenues for voter-approved and non-voter approved debt overall, and cannot exceed 6.0% of General Fund revenues for non-voter approved debt alone. The 6.0% ceiling for non-voter approved debt may be exceeded, only if there is a guaranteed new revenue stream for the debt payments and the additional debt will not cause the ratio to exceed 7.5%, or there is no guaranteed revenue stream but the 6.0% ceiling shall not be exceeded for more than one year.
Of the $28.5 billion long-term bonds and notes payable, $700.2 million were General Obligation bonds.